I run a handful of servers: this blog, my plugin sites, and the servers behind my own products. For a long time, my way of monitoring them was simple. I waited for something to break.
The old way
When a site felt slow, I logged in over SSH and ran the usual commands: free -m for memory, htop for what was busy, df -h for disk. They are good commands, but they only show right now. If the trouble happened at 3 AM, by morning the numbers looked fine and I had nothing to go on.
I know the proper tools too. I work with Prometheus and Grafana, and they collect everything. But a memory graph still left me with the same question: is this server too small, or was that just a bad hour?
I did not need more graphs. I needed the numbers read for me.
So I built a small tool for myself
I wrote a small program that runs on each server. It only reads; it never changes anything. Every 10 seconds it looks at the server, and every minute it saves one record:
- How busy the processor was.
- How much memory and disk space were left, as real amounts.
- Which programs used the most memory and processor.
- Whether services like the web server, PHP and the database were running.
- Whether the system had to kill a program because memory ran out.
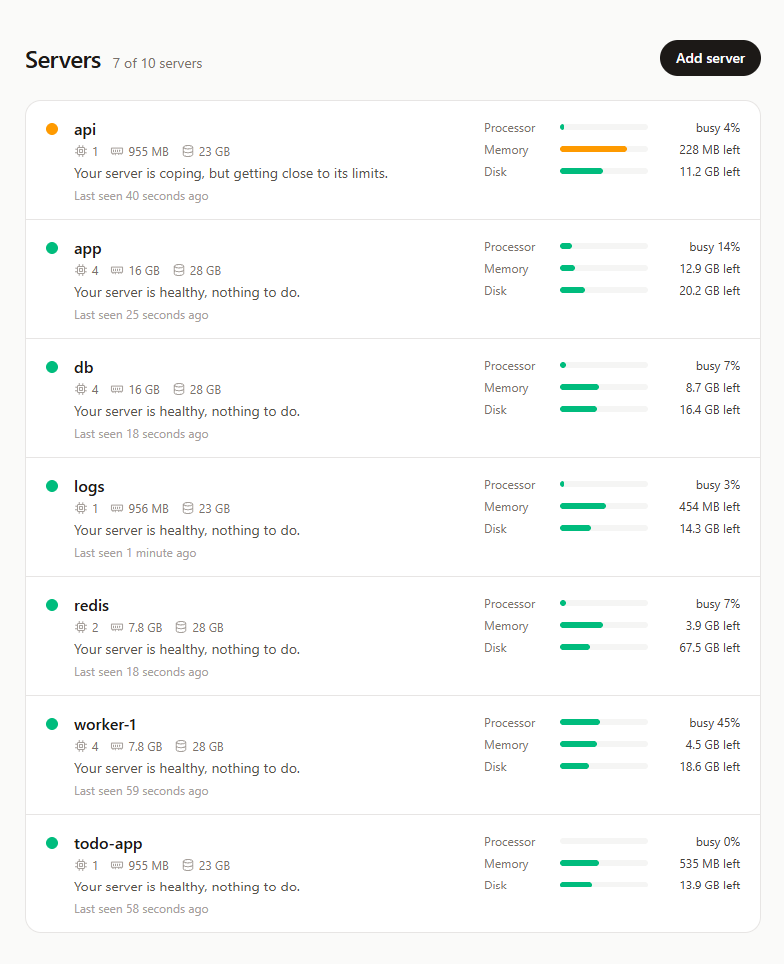
Those minutes go to a small Laravel app. The app does the part I actually wanted: it turns the minutes into plain sentences. What is wrong, why it matters, and what to do.
What I look at now
Instead of graphs, I read one short verdict per server. When something needs attention, it looks like this:
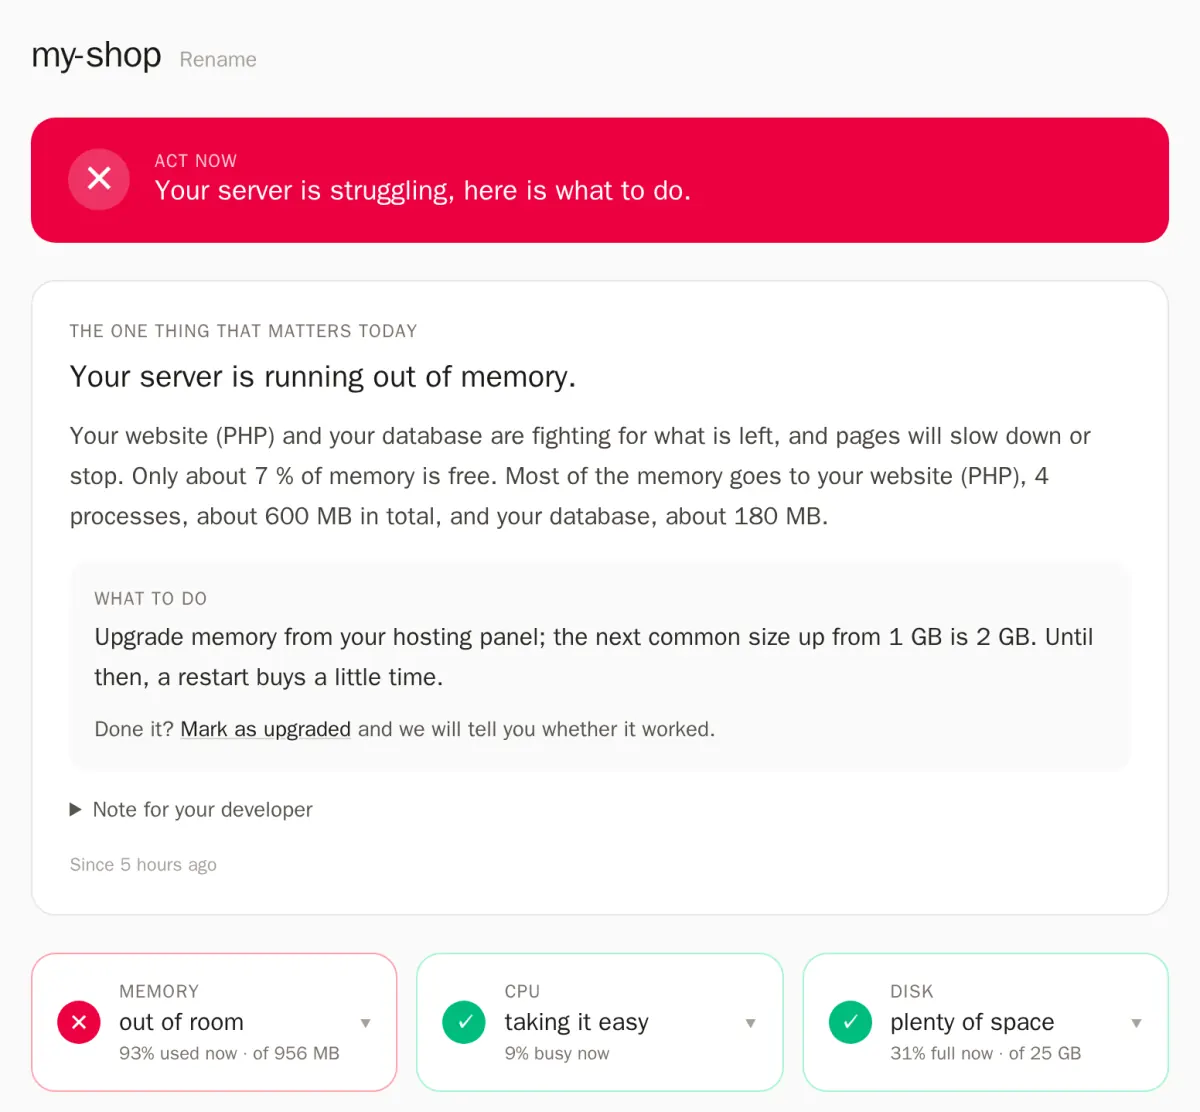
- The usual level, not one bad minute. It keeps 14 days of history and tells me what is normal for each server, so a short spike does not look like a trend.
- Who used the memory. Most of the time it is PHP or the database, and it says which.
- PHP worker settings. When memory is short, it also checks how many PHP workers the server may start, and whether all of them together could need more memory than the server has.
- The next size up. When a server really is too small, it names the step, for example from 1 GB to 2 GB of memory.
- A Monday email with how each server did that week.
I can also ask Claude, “how are my servers doing?”, and it reads the same data.
What it changed
One night, one of my servers showed only 84 MB of memory free. A graph would have pushed me to upgrade. The verdict showed it lasted four minutes, during a burst of bot traffic, and that the server usually had around 740 MB free. Nothing to do.
Another server was short on memory day after day, with the database as the biggest user. That one did need more room. After the upgrade, the tool checked again and confirmed the problem had not come back.
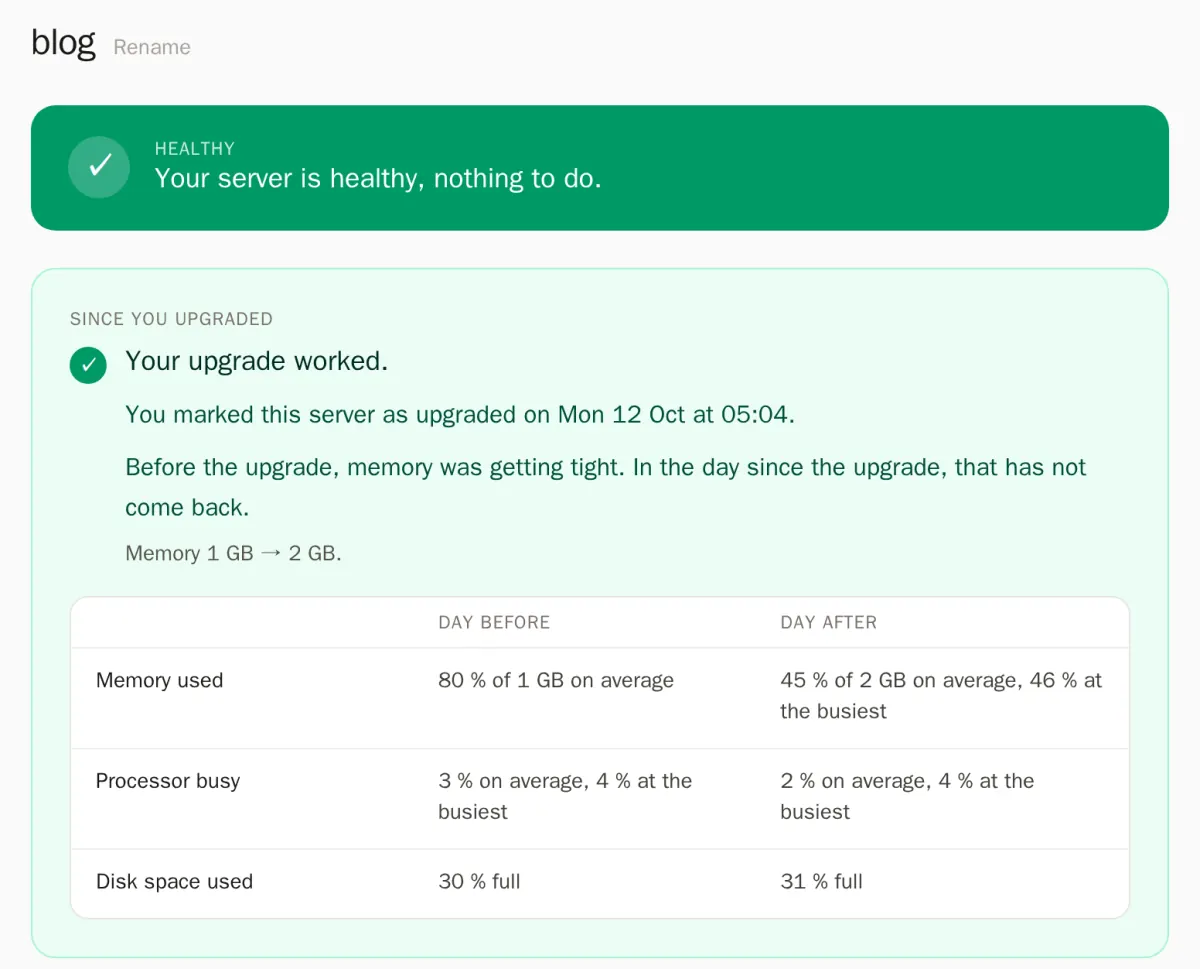
Now I upgrade when a server really needs it, and not before. And I find out about trouble from a sentence, not from a crash.
I called the tool PimiPulse. I built it for my own servers, and anyone who wants the same can use it at pimi.io/pulse.